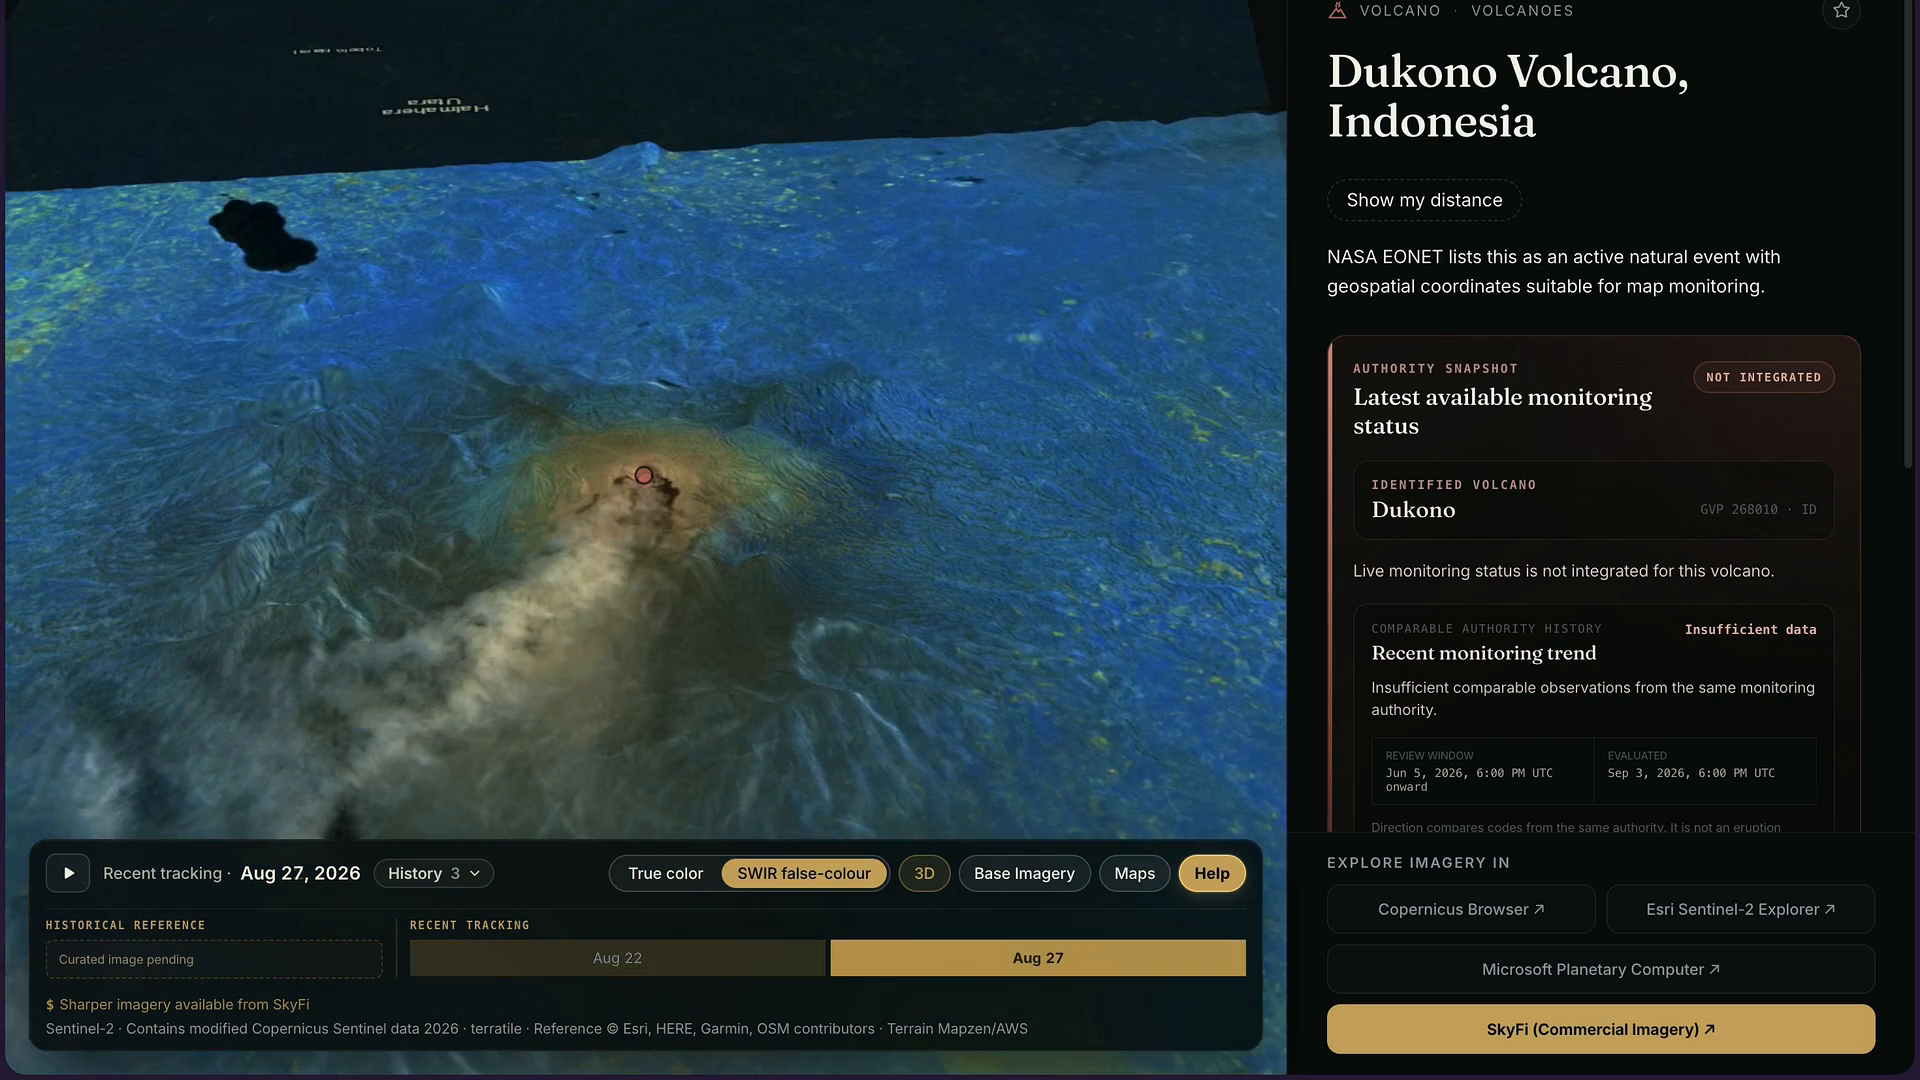
TerraByte News now tracks every active volcano on one free map. Each volcano gets its own page that combines the Smithsonian Global Volcanism Program record, the latest official alert level where an observatory publishes one, and a dated Sentinel-2 satellite imagery timeline with true color, shortwave infrared and 3D terrain views. No account is required. Start at news.terrabyte.ai.
Which volcanoes does TerraByte News track?
TerraByte News is a free live map that pairs official natural event feeds with current satellite imagery. Its volcano list comes from two catalogs. NASA EONET (Earth Observatory Natural Event Tracker) is an open API that publishes a curated, continuously updated list of natural events; its volcano entries come from the Smithsonian and from NASA Earth Observatory. The Smithsonian Institution Global Volcanism Program (GVP) is the reference catalog of the world's 1,214 Holocene volcanoes and keeps the running record of which ones are erupting.
On September 3, 2026, EONET listed 33 open volcano events, and the Smithsonian counted 40 volcanoes in continuing eruption as of March 31, 2026, with at least 20 erupting on any given day. Between the two catalogs, TerraByte News has pages for volcanoes including Kilauea (Hawaii), Etna and Stromboli (Italy), Dukono, Ibu, Lewotobi, Merapi and Semeru (Indonesia), Popocatepetl (Mexico), Sabancaya (Peru), Fuego (Guatemala), Sheveluch and Bezymianny (Russia), and Mayon and Kanlaon (Philippines).
Each TerraByte News volcano page carries the Smithsonian volcano number in its address. Kilauea is news.terrabyte.ai/events/volcano-gvp-332010, and Dukono is news.terrabyte.ai/events/volcano-gvp-268010. To see only volcanoes on the main map, open the Filter menu and pick volcanoes.
What does a volcano page in TerraByte News show?
A volcano page in TerraByte News is one screen with four parts:
- A Sentinel-2 imagery timeline. The bottom bar lists the recent satellite passes over the volcano by date. Press play, or click a date, to step through them and watch the plume, ash footprint and lava field change. A History control holds earlier reference images.
- Three ways to look at the same pixels. True color at 10 m resolution shows what a person would see. The shortwave infrared (SWIR) false color view makes hot lava glow and cuts through smoke and haze. The 3D terrain view drapes the image over elevation so you can read which way a slope, and therefore a flow, runs.
- A monitoring status panel. Where TerraByte has integrated the responsible observatory, the panel shows the current alert level, the aviation color code, the observatory name, when the notice was issued and when TerraByte last checked it. It also compares the latest codes from the same authority and reports a trend. For Kilauea on September 3, 2026, the panel read Alert Level: Advisory, Aviation Color: Yellow, Observatory: Hawaiian Volcano Observatory, trend: broadly steady, with checks logged daily. Where no observatory feed is integrated yet, as for Dukono, the panel says so instead of guessing.
- Sources and ways to go deeper. Every page links to its source records at NASA EONET and the Smithsonian GVP and, where a status feed exists, the official notice, plus buttons to open the same location in Copernicus Browser, Esri Sentinel-2 Explorer and Microsoft Planetary Computer. Sharper commercial imagery is available through SkyFi.
Two smaller features help when a volcano is near you. "Show my distance" tells you how far the vent is from your location, and the Near Me view on the main map sorts every event by distance.
Why should anyone care about watching a volcano from orbit?
Volcanoes are not a niche hazard. Around 800 million people, roughly one tenth of the world's population, live within 100 km of an active volcano, according to the 2015 Cambridge University Press assessment Global Volcanic Hazards and Risk. Ash plumes close airspace, which is why observatories publish an aviation color code next to the alert level and why TerraByte News shows both. And people travel to volcanoes on purpose: Hawaiʻi Volcanoes National Park alone recorded 1,433,593 visitors in 2024, according to the National Park Service.
For all of those people the information problem is the same. Text reports, even excellent ones from the observatories, describe a state that keeps changing. The satellites that could show the current state pass overhead every few days, and the imagery is public, but it sits in archives built for scientists. Finding the right scene, the right date and the right band combination for one volcano takes a GIS (geographic information system) specialist an afternoon. TerraByte News does that step in advance for every active volcano, so anyone can do it in one click.
Who this is for, concretely:
- A traveler deciding whether the lava is likely to be visible this week.
- A journalist or editor who needs a dated satellite view of an eruption without licensing a commercial image.
- A researcher or student who wants the recent Sentinel-2 passes over a specific volcano without writing a STAC (SpatioTemporal Asset Catalog) query.
- An analyst covering aviation, insurance or supply chains who needs the official status and the picture on the same page.
Why does shortwave infrared matter for watching a volcano?
Fresh lava erupts at roughly 700 to 1,200 degrees Celsius, and material that hot radiates strongly in the shortwave infrared. Sentinel-2 carries two SWIR bands, band 11 at 1,610 nm and band 12 at 2,190 nm, both at 20 m resolution, and a composite that maps band 12 to red, band 11 to green and band 4 to blue is the standard way to spot active lava from orbit. In that view a cooling flow looks dark and a hot vent or channel glows.
The second benefit is atmospheric. Smoke, haze and thin volcanic plumes scatter visible light far more than they scatter shortwave infrared, so the SWIR false color view in TerraByte News often shows the crater and the flow field clearly on a day when the true color view is a grey smear. That is the difference between reading that a volcano is erupting and seeing where the lava is.
SWIR does not see through thick cloud. On a fully overcast pass the pixels are blank in every optical band. Radar, specifically SAR (synthetic aperture radar) from satellites such as Sentinel-1, is the sensor that images through cloud, and TerraByte News does not include it today. The imagery timeline always shows the date of each pass, so you know how old the picture is.
A personal example: the next time I go to see Kilauea
A note from Rishi Madhok, co-founder and CEO of TerraByte.
Kilauea is the reason I wanted this feature. It has been in an episodic lava fountaining eruption at Halemaʻumaʻu crater, inside the summit caldera, since December 23, 2024. The episodes come and go. The Hawaiian Volcano Observatory reported that episode 54 ended at 7:33 p.m. Hawaii time on August 25, 2026, after nine hours of continuous fountaining. If you fly to the Big Island hoping to see lava, the honest answer to "will it be going when I get there" is that nobody knows, and the second question, "what has it been doing lately," used to take a stack of browser tabs to answer.
Here is what I will do on the next trip. Open the Kilauea page in TerraByte News on my phone. The monitoring panel tells me the observatory's current alert level and aviation color code (Advisory and Yellow as I write this), when the notice was issued, and whether the code has moved across the last few daily checks. Then I scrub the Sentinel-2 timeline back through the recent passes, flip to SWIR false color, and look for the bright signature of fresh lava in the crater; hot rock glows in shortwave infrared even when the visible image is washed out by the haze that hangs over the summit. Then I switch on 3D terrain to see the caldera as a bowl instead of a flat map, and tap "Show my distance" to see how far I am from the vent. Five taps, and I know more about what the mountain has done this week than any article would tell me.
The honest caveats are the same ones in the rest of this post. Sentinel-2 only passes every few days, cloud can hide a pass entirely, and the observatory's webcams and the park's own alerts remain the sources for whether a viewing area is open. What TerraByte News adds is the missing layer: the pixels and the official status on one page, so I arrive already knowing what the last few passes showed.
How is TerraByte News different from the Smithsonian, USGS and Copernicus Browser?
Each of these is a source TerraByte News uses and links to. None of them does the whole job on one page.
| Tool | What it gives you | What it leaves to you |
|---|---|---|
| Smithsonian Global Volcanism Program | The authoritative catalog, eruption history, and the weekly Smithsonian/USGS volcanic activity report | No imagery viewer, no per-volcano satellite timeline |
| Volcano observatories (USGS Hawaiian Volcano Observatory, Alaska Volcano Observatory and others) | Official alert levels, aviation color codes and notices for the volcanoes they monitor | Coverage is limited to that observatory's volcanoes; there is no global list |
| Copernicus Browser, Esri Sentinel-2 Explorer, Microsoft Planetary Computer | The full Sentinel-2 archive and your choice of band renderings | You need to know where and when to look, and there is no event feed |
| TerraByte News | The global event feed, the latest official status, and curated dated Sentinel-2 passes on one page, with links to each of those sources | Anything requiring radar, sub-meter detail or a forecast |
TerraByte News is free and needs no account. The observatories and the Smithsonian remain the source of record for safety decisions.
What TerraByte News does not do
- It is not an eruption forecast or safety advice. The monitoring panel compares codes from the same authority to show direction of travel. The official notice from the observatory is the document to act on.
- It does not see through cloud. Sentinel-2 revisits the equator every five days, and mid latitudes more often, but a cloudy pass is a lost pass. Imagery over a persistently cloudy volcano can be days or weeks old, and the date is always displayed.
- It does not have a live observatory feed for every volcano. Where a feed is not integrated, the panel states that plainly rather than showing stale or inferred values.
- It is not a substitute for commercial imagery. Sentinel-2 is 10 m in true color and 20 m in SWIR. For a specific crater at sub-meter resolution, use the SkyFi link on the page.
How the volcano tracker fits the rest of TerraByte
TerraByte builds a search engine for the Earth. The same indexing technology that finds, dates and serves the Sentinel-2 passes behind each volcano page powers TerraByte's Earth search platform at portal.terrabyte.ai, where a user describes what they want to find in plain language, from solar farms under construction to vessels in a port, and gets back ranked satellite scenes with coordinates and dates. The same platform is available to developers as a JSON REST API (POST /api/search).
TerraByte News launched in July 2026 with wildfires, earthquakes, cyclones and severe weather. The earlier post, TerraByte News: how to see an active wildfire from space, explains the original design. The volcano tracker adds two things to it: a catalog-driven list of active volcanoes from NASA EONET and the Smithsonian, and an official monitoring status panel next to the imagery. Text tells you a volcano erupted. Pixels tell you what it did next.
Try it at news.terrabyte.ai, and see more of what the platform does at terrabyte.ai/use-cases.